As data becomes increasingly important for businesses, the need for tools to help visualize and analyze data is growing. Data visualization tools help businesses make sense of large amounts of data and improve decision-making. In this article, I will compare two of the most popular data visualization tools, Tableau and Power BI.
Introduction to Data Visualization and its Importance
Data visualization is the process of presenting data in a graphical or visual format that makes it easier to understand and analyze. Data visualization is important because it helps businesses make better decisions by identifying patterns, trends, and insights that might not be immediately apparent from raw data.
Data visualization tools are software applications that help businesses create visual representations of their data. These tools allow businesses to create charts, graphs, and other visualizations that make it easier to see patterns and trends.
What are Data Visualization Tools?
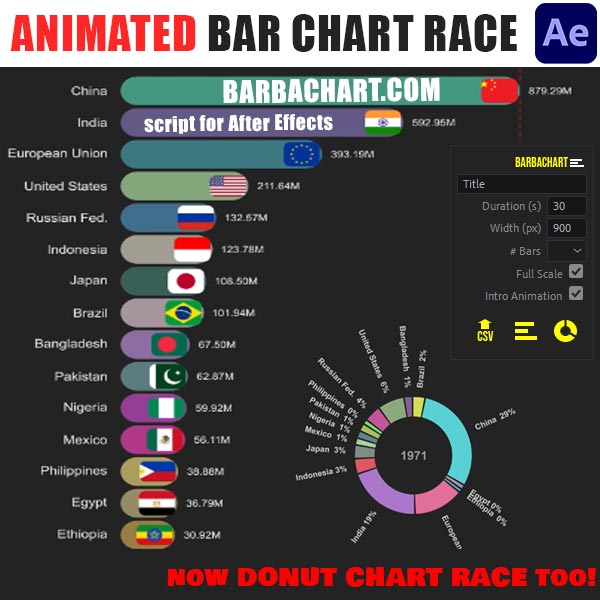
Data visualization tools are software applications that help businesses create visual representations of their data. These tools allow businesses to create charts, graphs, and other visualizations that make it easier to see patterns and trends. Some tools are generalist, meaning that you can create a wide range of data visualizations, while others are more specific, like in the case of Bar Chart Race Tools.
There are many data visualization tools available, but two of the most popular are Tableau and Power BI. Both of these tools are powerful and flexible, but they have some important differences.
Overview of Tableau and Power BI
Tableau is a data visualization software that helps businesses create interactive visualizations, dashboards, and reports. Tableau is known for its ease of use and flexibility, making it a popular choice for businesses of all sizes. It is owned by Salesforce, so it is well integrated with their set of business tools, but it works really well even as a stand alone product. Tableau has both a browser based interface and a desktop one.
Power BI is a cloud-based business analytics service that helps businesses analyze data and share insights. Power BI offers a wide range of features and tools, making it a powerful choice for businesses that need advanced analytics capabilities. It is owned by Microsoft and is perfectly integrated with the other Microsoft applications and environments, Excel above all.
Comparison of Tableau and Power BI Features
Tableau and Power BI both offer a wide range of features and tools for data visualization and analysis. However, there are some important differences between the two.
One of the key differences between Tableau and Power BI is their approach to data preparation. Tableau is designed to work with clean, well-organized data, while Power BI has more advanced data preparation capabilities.
Tableau also offers more advanced visualizations, including the ability to create complex charts and graphs. Power BI, on the other hand, has more advanced analytics capabilities and can be integrated with other Microsoft products.
Tableau comes with many pre-installed geographical data such as Countries, Administrative Boundaries, Postal Codes, Cities. It is therefore easy to create charts based on Maps.
Data Visualization Examples using Tableau and Power BI
To help illustrate the capabilities of Tableau and Power BI, let’s look at some data visualization examples created using each tool.
Tableau Data Visualization
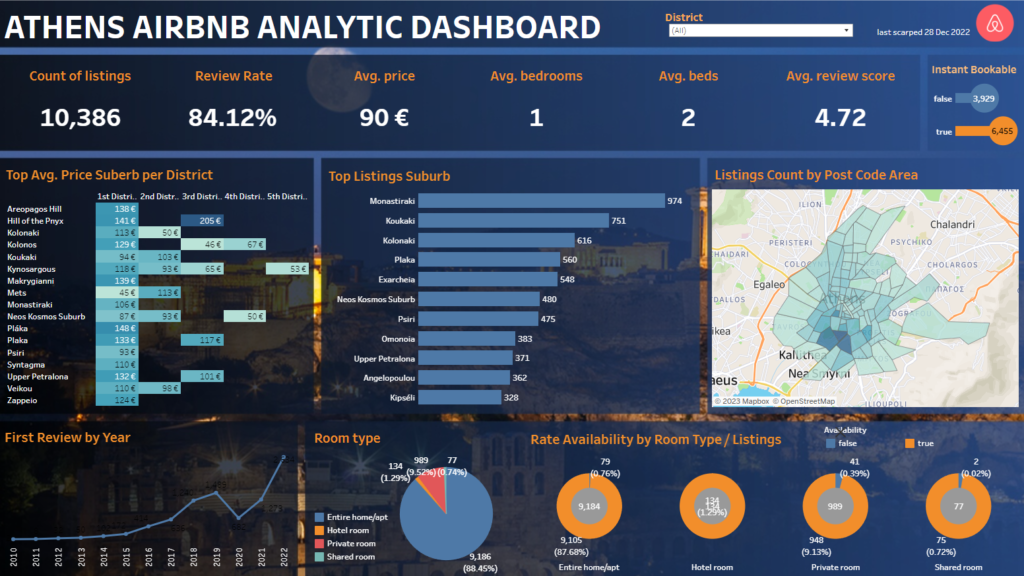
The best way to have a look at what Tableau can do is to visit the Tableau Public Discover webpage, where many data visualisation experts expose their public work. One example of a Tableau data visualization is the following dashboard that shows an analysis of Athens airbnb. The dashboard includes a map that shows listings by region and different bar charts, pie charts, line charts. It’s an interactive dashboard, as you are able to use different filters and get more data by hovering the charts.
Power BI Data Visualization
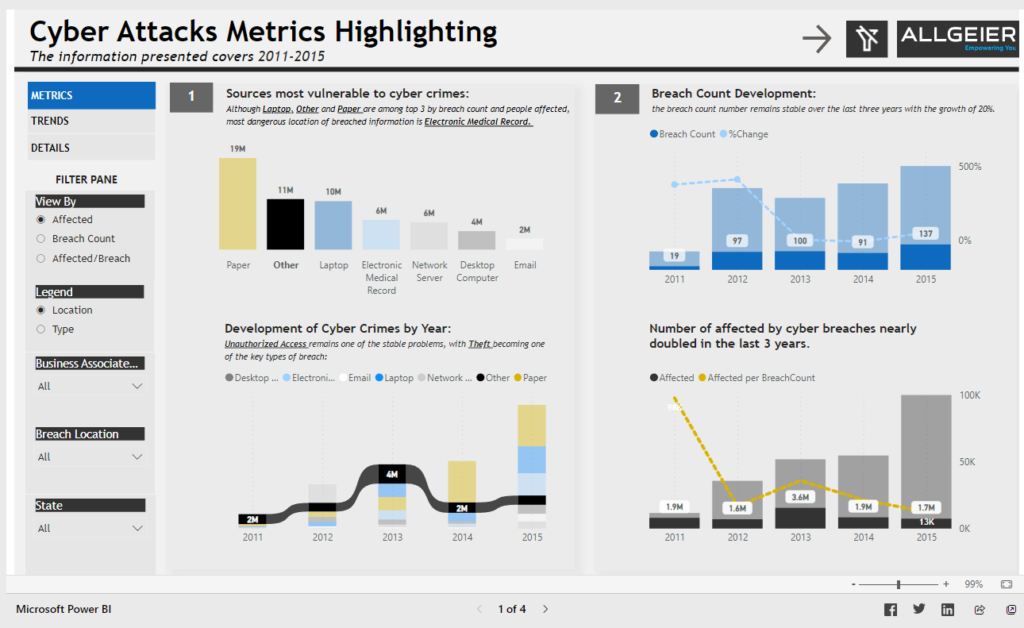
The easiest way to see some PowerBI examples, is to visit the Data Stories Gallery. One example of a Power BI data visualization is a dashboard that shows Cyber attacks Metrics Highlighting. The dashboard includes a bar chart that shows more vulnerable sources, a flow chart showing the development of cyber crimes over the years and different filters. This is a multi page report.
Costs and Pricing of Tableau and Power BI
Tableau and Power BI both offer a range of pricing options. Tableau offers a free trial and then charges per user per month. Power BI offers a free version and then charges per user per month for the Pro version.
Tableau’s pricing can be more expensive than Power BI, especially for larger businesses. However, Tableau’s advanced features may be worth the extra cost for some businesses.
About Tableau Pricing, the Tableau Creator license is, at the time of writing this article, $70 per user/month, while the PowerBI pricing starts with a $10/month for the PowerBI Pro license.
User Interface and Ease of Use Comparison
Both Tableau and Power BI are known for their ease of use and intuitive user interfaces. However, there are some differences between the two.
Tableau is known for its drag-and-drop interface, which makes it easy to create visualizations quickly. Power BI has a similar interface but also offers more advanced customization options.
Tableau’s interface is also more visually appealing than Power BI’s, which can be important for businesses that want to create polished, professional-looking visualizations.
Customization and Flexibility of Tableau and Power BI
One of the strengths of both Tableau and Power BI is their flexibility and customization options. Both tools offer a wide range of customization options, including the ability to create custom visualizations and dashboards.
Tableau is known for its flexibility and ability to handle large amounts of data. Power BI, on the other hand, is more focused on advanced analytics capabilities and can be integrated with other Microsoft products.
Integration Capabilities with Other Software and Platforms
Both Tableau and Power BI offer integration capabilities with other software and platforms. Tableau can be integrated with a wide range of data sources, including Salesforce and Google Analytics. Power BI can be easily integrated with other Microsoft products, including Excel and SharePoint. Furthermore, the PowerBI Premium license allows individual users to accelerate access to insights with advanced AI.
However, Tableau’s integration capabilities are generally considered to be more advanced than Power BI’s. Tableau also offers a wide range of connectors and APIs, making it easier to integrate with other software and platforms.
Customer Support and Community Resources
Both Tableau and Power BI offer customer support and community resources. Tableau offers a wide range of resources, including online tutorials and a large community of users. Power BI offers similar resources, including a very active community forum and online documentation.
Pros and Cons of Tableau and Power BI
Tableau and Power BI both have their strengths and weaknesses. Tableau is known for its flexibility and advanced visualizations, while Power BI is known for its advanced analytics and data cleaning capabilities and integration with other Microsoft products.
Tableau’s pricing can be more expensive than Power BI’s, especially for larger businesses. Power BI’s interface is not as visually appealing as Tableau’s, which can be important for businesses that want to create polished, professional-looking visualizations.
Have a look at this very comprehensive video comparison of Tableau and Power BI
Conclusion and Which Data Visualization Tool is Right for You
In conclusion, both Tableau and Power BI are powerful data visualization tools that can help businesses make sense of their data. Tableau is better suited for businesses that need advanced visualizations and flexible data handling capabilities. Power BI is better suited for businesses that need advanced analytics capabilities and integration with other Microsoft products.
When choosing between Tableau and Power BI, it’s important to consider your business’s specific needs and budget. A free trial of both tools can help you determine which one is the best fit for your business.

