Bar Chart Races have become popular in the last years, mainly because of the statistics about the Pandemic.
They compare things on one attribute, over a long time period. You may already have seen chart races of the most popular YouTubers or songs, but some of the most eye-opening races show an aspect of economic history. They have now being integrated in the modern Data Storytelling experience.
There are several tools that can be used to create bar chart races, here some of the best ones:
These are just some examples and there are many other tools available depending on the use case and the level of complexity required. Let’see in detail what you can do with all these Data Animation and Visualisation tools.

BarbaChart
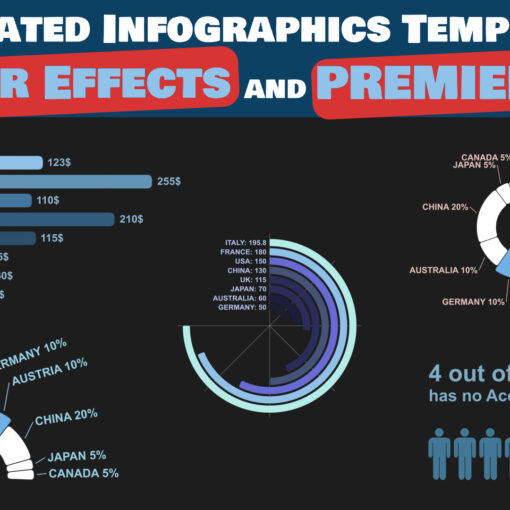
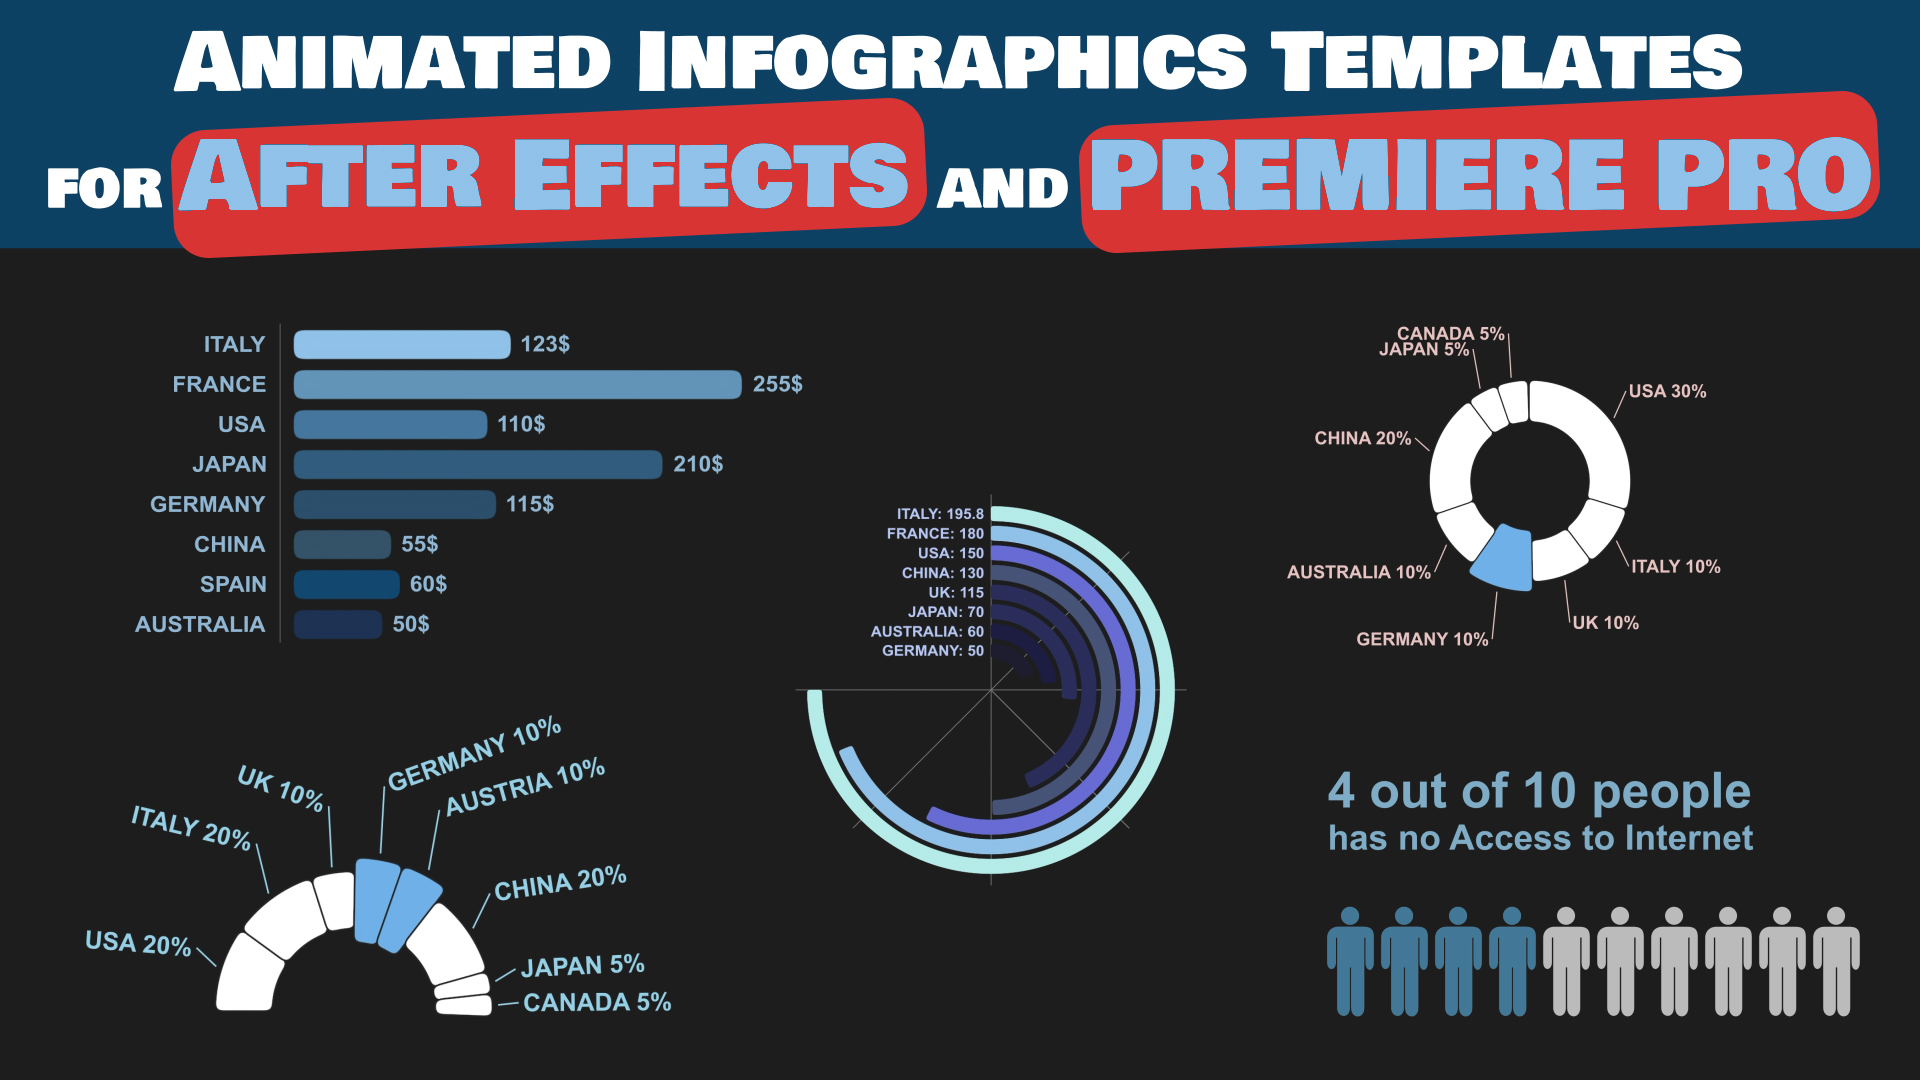
BarbaChart Race is a script to create Chart Races in Adobe After Effects. This means that you need to have After Effects installed on your machine and know how to use it. That being said, this is one of the most powerful implementations because of the nature of After Effects. It allows to customise all aspects with enormous possibilities. This is a perfect tool if you are a Motion Designer or Videographer, or have some AE knowledge.
The script allows to import a CSV file in AE. Once this is done, you can create a Vertical Bar Chart Race, a Horizontal Bar Chart Race or even a Donut Bar Chart Race. It is possible to select the duration of the animation, the size, the number of bars and colors. After the creation of the composition containing the race, every single aspect can still be modified using standard After Effects properties. The bar Chart race can be exported to a video file or a gif file, or any other video animation format supported by the AE.
BarbaChart also offers a custom Data Visualisation video creation service for those not willing to use After Effects.
Download here the BarbaChart Data Animation Script for After Effects.
Requirements:
- After Effects
MatPlotLib
Matplotlib is a widely used Python library for data visualization, it has a wide range of customization options, and it can also be used with other libraries like seaborn and pandas for more advanced visualizations.
Here is a good tutorial to create a bar chart race using Matplotlib and some other python libraries
This will require a some prerequisites:
- Python installed on your machine
- pip: package management system (it comes with Python) (alternatively, you can use Conda)
- Pandas: a library to prepare data for plotting
- Matplotlib: a plotting library
- Bar Chart Race: a library to create bar chart races with Matplotlib
- Jupyter Notebook: an online editor for data visualization
- FFmpeg: a tool to generate a video file with the animated char
Flourish
Flourish is a very powerful web-based platform that allows you to create interactive data visualizations, including bar chart races, without any coding required.
Bar Chart Races in Flourish are very easy to create starting from your own data. You have quite a lot of parameters ready to be used.
There is a free version where you can do some interesting animation, but if you need custom format videos you will have to switch to a paid subscription, whose price can be intimidating for many!
Requirements:
- an internet browser
Plotly
Plotly is another popular Python library for data visualization, it offers similar functionality to matplotlib, but with more interactive and web-based capabilities.
Here you can find an interesting tutorial about bar chart races using plotly.
Requirements:
- Python Knowledge
SJ Visualiser
SJ Visualiser is an open source Python Library initially developed by Sjoerd Tilmans, a Dutch Data Visualisation expert living in the UK.
You can follow his online tutorials to create a bar chart race or a donut chart race starting from an Excel file. You will need some programming knowledge and a python Code Editor.
The library is available on Github here: https://github.com/SjoerdTilmans/sjvisualizer
Requirements:
- Python Knowledge
- Python Code Editor
D3.js
D3.js is a JavaScript library for creating dynamic and interactive data visualizations, it is widely used for creating bar chart races and other types of visualizations.
You can find here a tutorial on how to create a bar chart race with d3.js if you are a Javascript developer.
Requirements:
- Javascript knowledge
Tableau
Tableau is a data visualization tool that allows you to create interactive visualizations, including bar chart races, with drag-and-drop functionality and no coding required. It’s one of the biggest players on the market. You can find a more generic presentation of Tableau here.
That being said, Tableau does not automatically create animated bar charts from a dataset. you will need some work around, which is well described in this article on this Tableau tutorial.
Requirements:
- a Tableau Subscription

