As a data analyst, I know how crucial it is to work with clean data for effective decision-making. Dirty data can lead to inaccurate insights and ultimately, wrong decisions. Therefore, data cleansing is an essential step in any data analysis process. In this ultimate guide, I’ll take you through everything you need to know about data cleansing for effective data visualization.

Introduction to Data Cleansing
Data cleansing is the process of identifying and correcting errors, inconsistencies, and inaccuracies in data. It involves removing irrelevant information, filling in missing data, and standardizing data formats. The goal of data cleansing is to ensure that the data is accurate, complete, and consistent.
What is Clean Data and Why is it Important?
Clean data is data that is free of errors, inconsistencies, and inaccuracies. It is data that has been thoroughly cleansed and is ready for analysis. Clean data is essential for effective decision-making because it ensures that the insights derived from the data are accurate and reliable.
Clean data also reduces the risk of making wrong decisions based on inaccurate or incomplete data. It saves time and resources by eliminating the need to manually correct errors or inconsistencies in the data.
Have a look at this introductory video taken from the Google Data Analytics Professional Certificate course.
The Consequences of Using Dirty Data
Using dirty data can have severe consequences. It can lead to inaccurate insights, which can result in wrong business decisions. It can also damage the reputation of the organization by providing incorrect information to stakeholders.
Using dirty data can also result in wasted resources. It can take a lot of time and effort to manually correct errors or inconsistencies in the data. In some cases, it may not even be possible to fix the data, resulting in wasted resources.
Techniques for Data Cleansing
There are various techniques for data cleansing, depending on the type of data and the tools available. Some of the most common techniques include:
Removing Duplicates
Duplicate data can skew the results of the analysis. Removing duplicates ensures that the data is accurate and reliable.
Filling in Missing Data
Missing data can lead to incomplete analysis. Filling in missing data ensures that the analysis is complete and accurate. Sometimes a data analyst will have to discuss with the business stakeholder to find out what data is missing. The may also decide to delete the incomplete data, if the sample is big enough.
Standardizing Data Formats
Standardizing data formats ensures that the data is consistent and easy to analyze. Typically, date format might be different when coming from different data sources. Another possibility is that numerical informations might come in as string and therefore should be transformed to numbers, using the cast function in SQL or the format cell function in Excel.
Removing Irrelevant Data
Irrelevant data can clutter the analysis and make it difficult to see the insights. Removing irrelevant data ensures that the analysis is focused and relevant.
Data Cleaning with Python – Step-by-Step Guide
Python is a powerful tool for data cleansing. Here is a step-by-step guide on how to clean data with Python:
- Import the necessary libraries (pandas, numpy).
- Load the data into a pandas data frame.
- Identify missing values and fill them in using the fillna function.
- Identify duplicates and remove them using the drop_duplicates function.
- Standardize data formats using the str function.
- Remove irrelevant data using the drop function.
- Export the cleaned data to a new file using the to_csv function.
Data Cleaning in SQL
SQL is another popular tool for data cleansing. Here are some steps to clean data in SQL:
- Identify the errors and inconsistencies in the data.
- Use SQL queries to clean the data (e.g., remove duplicates using the SELECT DISTINCT, fill in missing data using INSERT INTO).
- Check the data for accuracy and completeness using the WHERE and the ORDER BY clauses.
Data Cleaning in Spreadsheets (Excel, Google Sheets)
Spreadsheets are a common tool for data analysis, and they also have built-in features for data cleansing. Here are some tips for cleaning data in spreadsheets:
- Use filters to identify errors and inconsistencies in the data.
- Use formulas to fill in missing data and standardize data formats.
- Use conditional formatting to highlight duplicates and remove them.
Best Practices for Effective Data Visualization
Once the data is cleaned, it’s time to visualize it. Here are some best practices for effective data visualization:
- Keep it simple – avoid cluttering the visualization with too much information.
- Use the appropriate visualization for the data.
- Use color and labels to highlight the key insights.
- Provide context for the visualization.
- Test the visualization with different audiences to ensure that it’s easily understood.
Examples of Successful Data Visualization Using Clean Data
Data visualization is a powerful tool for communicating insights derived from data. Here are some examples of successful data visualization using clean data:
The New York Times – How Trump Reshaped the Presidency in Over 11,000 Tweets
This visualization shows how Donald Trump’s tweets changed over time and how they affected his presidency. The data is clean, and the visualization is easy to understand.
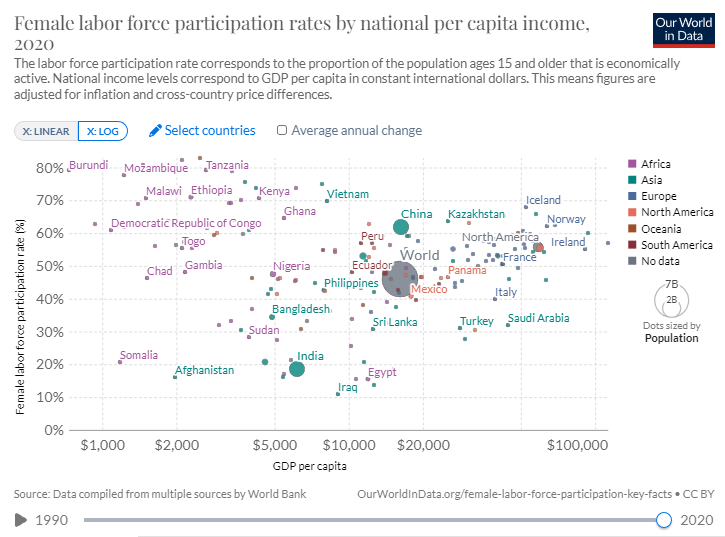
Our World in Data – The Female Labor-Force Participation Rate
This visualization shows the female labor-force participation rate across countries. The data is clean, and the visualization is simple and easy to understand.
Courses and Tools for Data Cleansing and Visualization
There are many courses and tools available for data cleansing and visualization. Here are a few recommendations:
Coursera – Data Cleaning
This course provides an introduction to data cleaning, including techniques in Python and R.
Tableau
Tableau is a popular tool for data visualization, and it also has built-in features for data cleansing.
DataCamp – Data Visualization with Python
This course provides an introduction to data visualization using Python.
Conclusion – The Importance of Data Cleansing for Effective Decision-Making
In conclusion, data cleansing is an essential step in any data analysis process. Clean data ensures that the insights derived from the data are accurate and reliable, reducing the risk of making wrong decisions. There are various techniques for data cleansing, depending on the type of data and the tools available. Once the data is cleaned, it’s important to follow best practices for effective data visualization. There are many courses and tools available for data cleansing and visualization, making it easier than ever to get started with data analysis.


