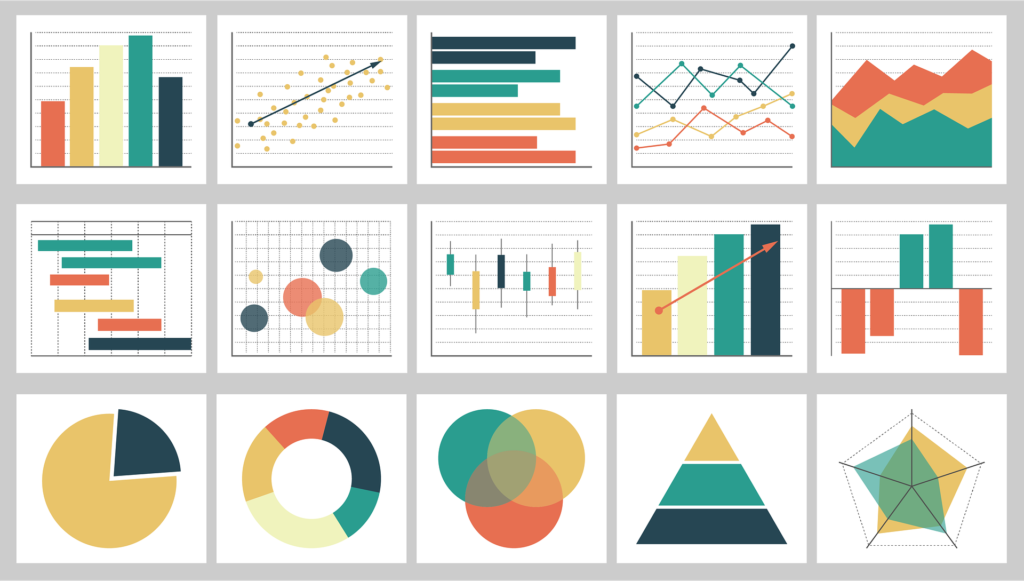
Data visualisation and animation are essential tools for conveying complex information in a concise and easy-to-understand way. While there are a variety of programming languages that can be used for these tasks, some are better suited for the job than others. Whether you’re a novice programmer or an experienced one, learning the best programming languages for data visualisation and animation can help you create effective and powerful graphs and charts.
From JavaScript to Python and beyond, this article will explore the best programming languages for data visualisation, as well as the advantages and disadvantages of each.
JavaScript
JavaScript is an object-oriented programming language that is mainly used for client-side scripting. Although it’s often used for front-end web development, JavaScript can be used for many other data visualisation and animation tasks, such as creating interactive graphs and charts. For example, d3.js is a popular JavaScript library for visualisation.
There are many other libraries and tools that are compatible with JavaScript, making it a versatile programming language. JavaScript is an easy programming language to learn and get started with, making it a good choice for beginners. Additionally, JavaScript runs on every device and platform, making it an excellent choice for creating cross-platform applications.
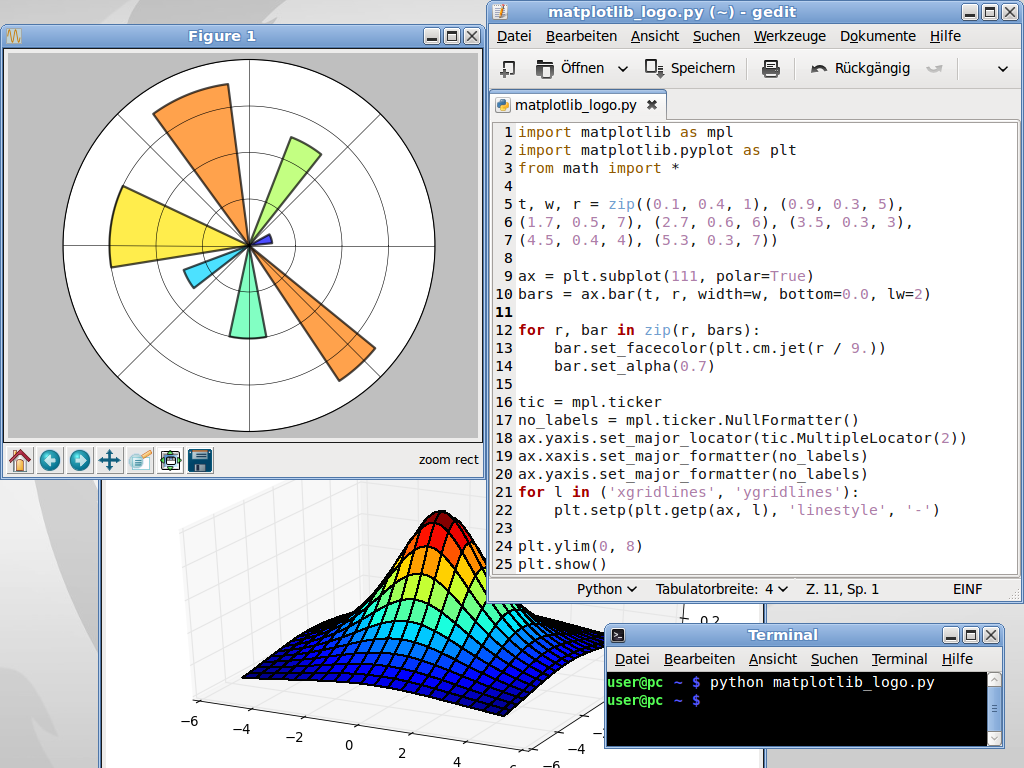
Python
Python is a general-purpose programming language that is often used for data analytics and scientific computing. It has a wide range of libraries and tools that allow you to create sophisticated data visualisations and animations. For example, the matplotlib library allows you to create charts and graphs, and the seaborn library allows you to create statistical graphs.
The python programming language is an excellent choice if you’re looking to create data visualisations and animations with a lot of complexity and detail. Python is also easy to learn and has a friendly syntax, making it a good choice for beginners. Since Python is cross-platform and open source, it’s widely used in many industries and organisations, which means it has a large and active community of users and developers.
C++
C++ is a general-purpose programming language that is used for everything from web development to computer graphics. It’s a compiled and object-oriented programming language that allows you to create sophisticated and detailed data visualisations and animations. C++ has many features that make it an excellent choice for data visualisation and animation, such as its ability to handle large data sets and high-performance functions. It also has a large number of libraries and tools that you can use for data visualisation and animation, such as the OpenGL library, which is used to create 3D computer graphics.
C++ is a relatively difficult programming language to learn and isn’t ideal for beginners. It is, however, a good choice if you’re looking to create detailed data visualisations and animations with high complexity.
Processing
Processing is a programming language and environment that is used for visual arts, design, and computer art. It was originally developed for artists and designers to create visual art pieces and images. Processing’s simplicity and ease-of-use make it a good choice for non-programmers to create data visualisations and animations. Additionally, its cross-platform compatibility makes it a good choice for creating web visualisations.
To visualise your data, you can use the built-in functions to create interactive graphs and visualisations. If you’re looking to create more complex data visualisations and animations, you can use the programming language, which is similar to C++ and Java, and allows you to create more sophisticated and detailed pieces.
R
R is an interpreted programming language and environment designed in 1993 for statistical computing and graphics. It’s commonly used in data science and big data applications where data visualisation and animation are essential. R’s ease-of-use and accessibility make it a good choice for non-programmers to create visualisations. Additionally, it’s cross-platform and open source, making it a good choice for web dataviz projects.
R has many built-in functions that allow you to create statistical graphs and visualisations. If you’re looking to create more complex data visualisations and animations, you can create more complex functions as R supports procedural programming with functions and, for some cases, object-oriented programming.
MATLAB
MATLAB is a programming language and environment for technical computing. It’s commonly used for advanced data visualisation, such as 3D visualisations and animations. Although it’s mainly used for more advanced and technical visualisations, MATLAB is also suitable for non-programmers who are just getting started with data visualisation. It’s cross-platform and open source, making it a good choice for web visualisations.
Personally I used it for the first time during my engineering studies at the university.
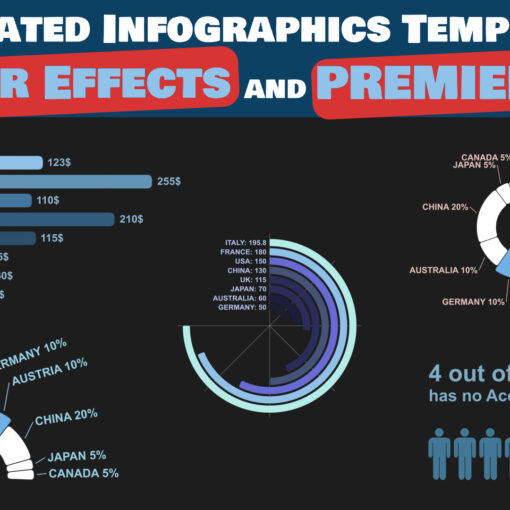
After Effects
After Effects is a visual effects and motion graphics software used to create visualisations and animations. It’s commonly used for motion graphics and web animations, transitioning between scenes and animated graphics. It has a lot of built-in functions and tools that allow you to quickly create animated videos.
After Effects also allows you to create very artistic animations: you can create graphs and charts, either 2D or 3D, with ease. If you’re looking to create more complex data visualisations, you can use the scripting language and expressions, which are based on javascript.
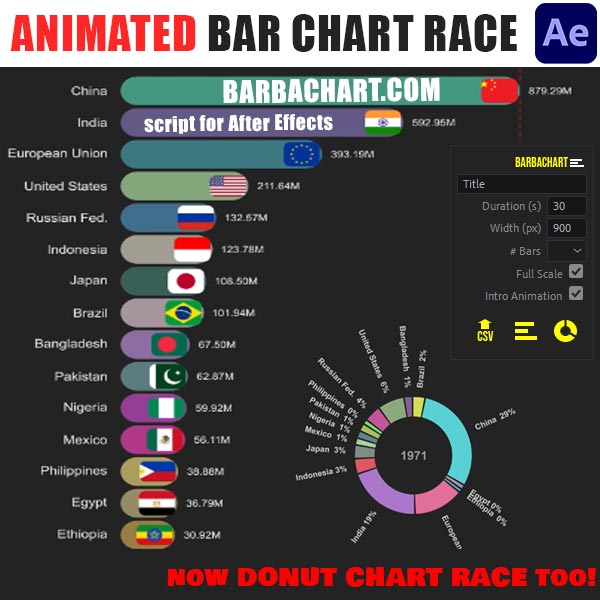
If you are a motion designer and need to create animated Bar Chart Races or Pie charts, you can choose BarbaChart, a Bar chart race script for After Effects.
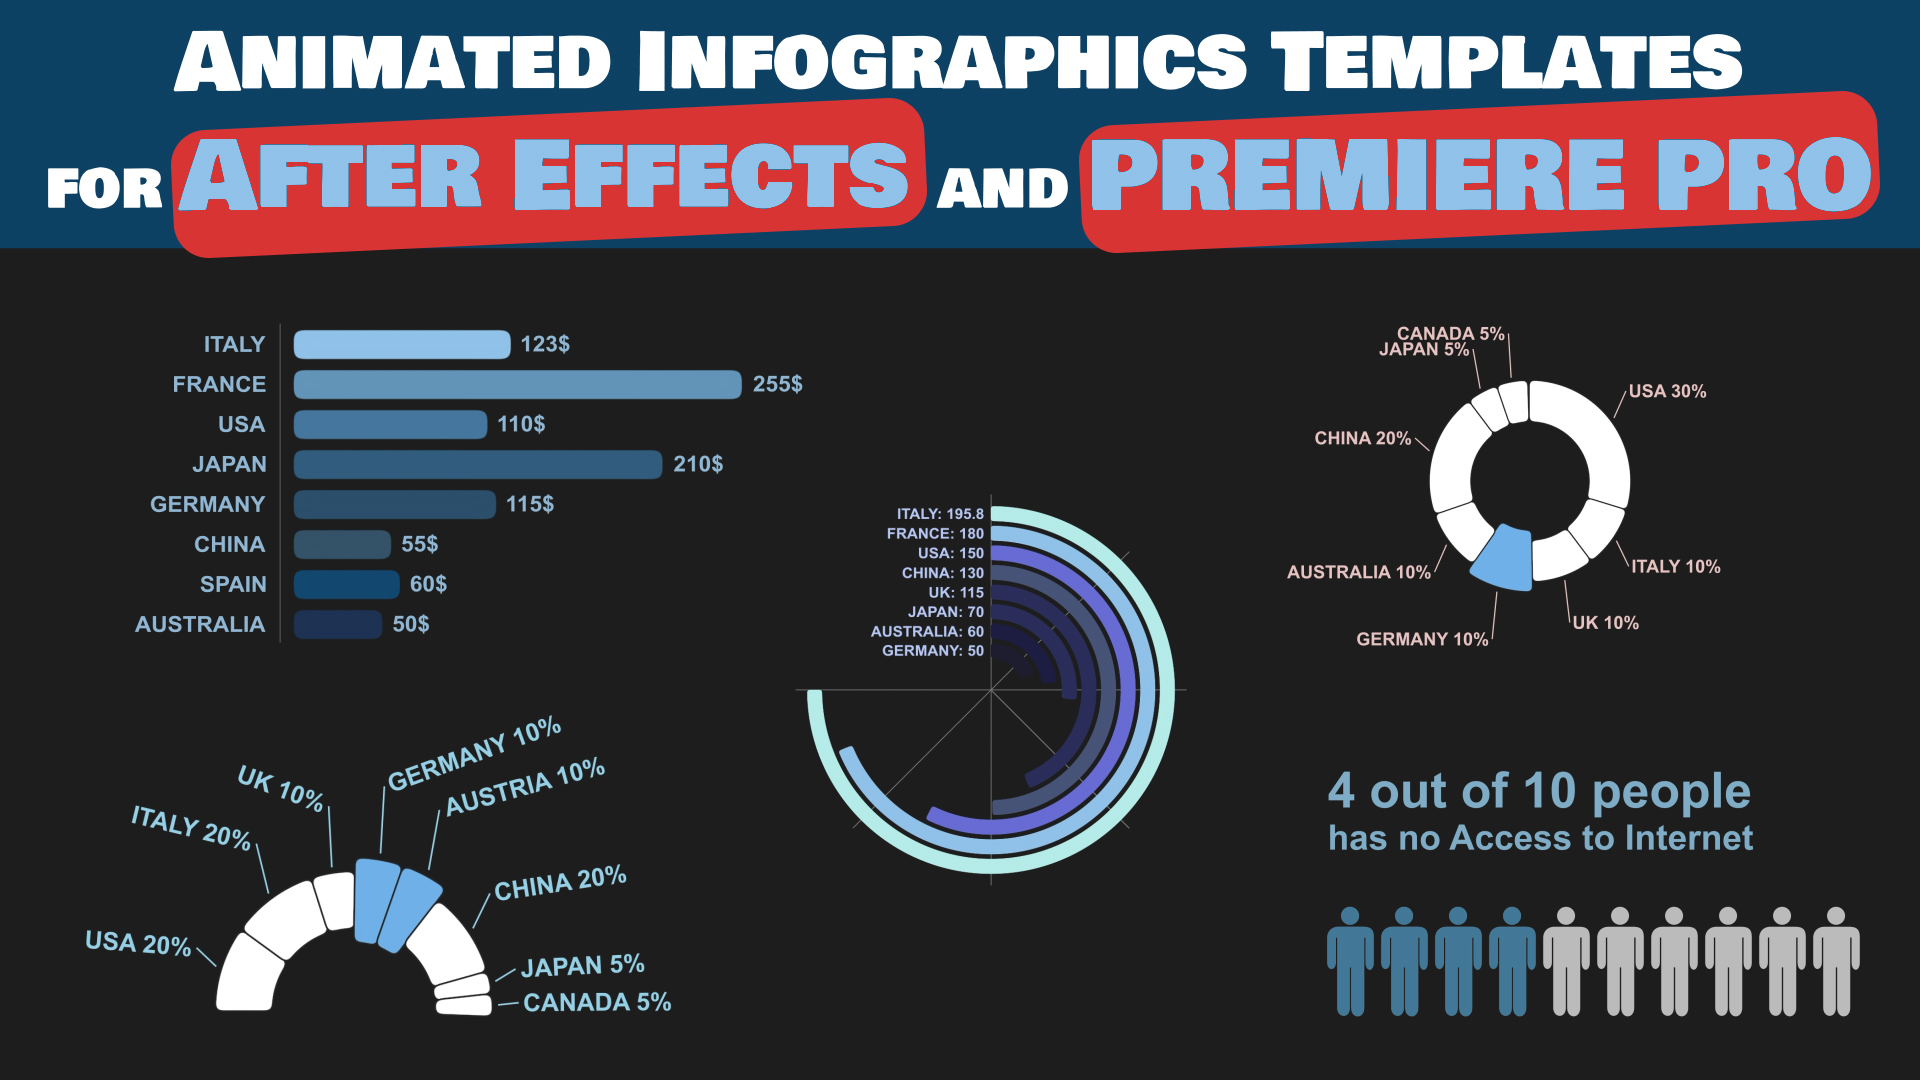
If you don’t like scripting or expressions, there is a large number of data visualisation templates for After Effects.
Conclusion
Creating data visualisations and animations with a programming language is a great way to present data in an engaging and easy-to-understand way. When choosing which programming language to use, you should consider your skill level, the complexity of your project, and the operating system of your target device or platform. Now that you know more about the best programming languages for data visualisation and animation, it’s time to put your newfound knowledge to good use!
Ultimately, the best choice of language or framework will depend on your specific needs and goals, as well as your existing skills and experience. It’s worth experimenting with different options to see which one you find the most comfortable and suitable for your task.
